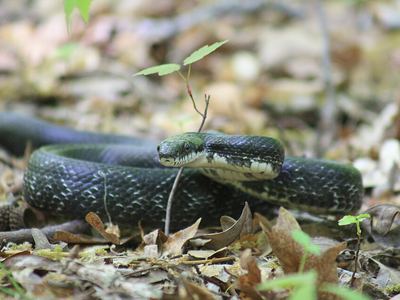
Queen snake (Regina septemvittata)
The queen snake (genus Regina) is a non-venomous snake in the family Colubridae. Among the 15 water snakes and swamp snakes profiled here, it ranks 3rd by number of states listed. Most of its 18 listed states are in the South Atlantic (8) and East North Central (4) census divisions. None is in the West. Its observation records peak in May.
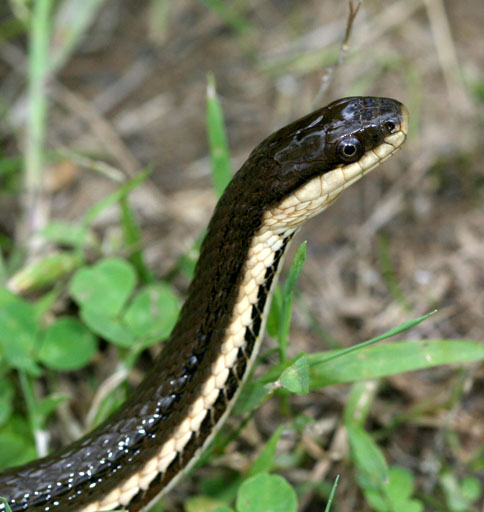

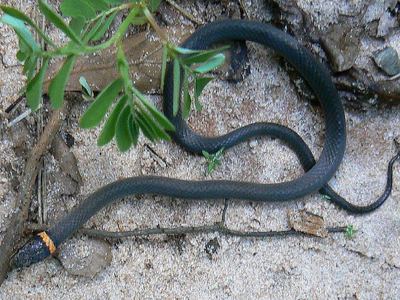
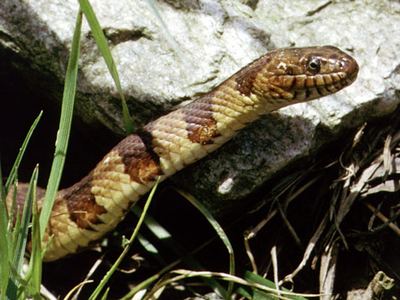
The queen snake (Regina septemvittata) is a species of nonvenomous semiaquatic snake, a member of the subfamily Natricinae of the family Colubridae. The species is endemic to North America.
From Wikipedia: Queen snake, text under CC BY-SA 4.0.
Is the queen snake poisonous or venomous?
No. The queen snake is non-venomous: it belongs to the family Colubridae, not to the pit vipers or coral snakes, the only U.S. land snakes with medically dangerous venom. It may bite if handled; clean the bite like any small wound.
Which states have the queen snake?
| # | State | Records | Share of state snakes | Rank in state |
|---|---|---|---|---|
| 1 | Pennsylvania | 581 | 6.7% | 4th of 20 |
| 2 | North Carolina | 343 | 1.6% | 20th of 39 |
| 3 | Ohio | 325 | 5.2% | 4th of 25 |
| 4 | Alabama | 188 | 3.2% | 11th of 44 |
| 5 | Virginia | 162 | 1.5% | 18th of 30 |
| 6 | West Virginia | 111 | 6.7% | 4th of 18 |
| 7 | Indiana | 95 | 4.2% | 8th of 27 |
| 8 | Tennessee | 63 | 2.4% | 13th of 32 |
| 9 | Michigan | 60 | 1.1% | 14th of 17 |
| 10 | Maryland | 58 | 1.6% | 14th of 20 |
| 11 | Kentucky | 45 | 3.5% | 11th of 24 |
| 12 | South Carolina | 32 | 0.9% | 28th of 40 |
| 13 | Georgia | 29 | 0.5% | 26th of 44 |
| 14 | Illinois | 25 | 0.9% | 22nd of 34 |
| 15 | New York | 20 | 0.3% | 15th of 17 |
| 16 | Florida | 4 | 0.0% | 49th of 50 |
| 17 | Delaware | 2 | 0.3% | 15th of 15 |
| 18 | Arkansas | 1 | 0.0% | 35th of 36 |
When is the queen snake seen?
Its observation records run mostly March through September.
Season by state
Where the season stays within one calendar year, it starts earliest in January (North Carolina) and latest in April (Ohio and Pennsylvania). June is the most common peak month (Ohio and Pennsylvania).
| State | Main season | Peak month | Observation records |
|---|---|---|---|
| North Carolina | January through September | July | 46 |
| Pennsylvania | April through October | June | 43 |
| Virginia | March through September | April | 39 |
| Tennessee | March through September | May | 38 |
| Ohio | April through September | June | 35 |
Where the queen snake is recorded in each state
| State | Licensed records | Place among the state's snakes | Most recorded counties |
|---|---|---|---|
| Pennsylvania | 581 | 4th of 20 | Allegheny County (138), Westmoreland County (116), Washington County (112), Armstrong County (26) and Greene County (22) |
| North Carolina | 343 | 20th of 39 | Watauga County (53), Orange County (38), Chatham County (24), Wake County (24) and Graham County (16) |
| Ohio | 325 | 4th of 25 | Montgomery County (66), Brown County (25), Erie County (22), Geauga County (19) and Delaware County (14) |
| Alabama | 188 | 11th of 44 | Lauderdale County (32), Jackson County (22), Lee County (20), Cleburne County (16) and Colbert County (16) |
| Virginia | 162 | joint 18th of 30 | Tazewell County (23), Scott County (16), Montgomery County (10), Rockbridge County (9) and Richmond (8) |
| West Virginia | 111 | 4th of 18 | Marshall County (28), Randolph County (12), Preston County (10), Marion County (7) and Tyler County (7) |
| Indiana | 95 | 8th of 27 | Jasper County (25), Marion County (7), Wayne County (6), Montgomery County (5) and Parke County (5) |
| Tennessee | 63 | joint 13th of 32 | Cheatham County (17), Sullivan County (9), Rutherford County (6), Davidson County (5) and Knox County (4) |
| Michigan | 60 | 14th of 17 | Washtenaw County (42), Oakland County (4), Kent County (3), Wayne County (2) and Ingham County (1) |
| Maryland | 58 | 14th of 20 | Garrett County (12), Montgomery County (12), Prince George's County (9), Frederick County (8) and Baltimore County (6) |
| Kentucky | 45 | joint 11th of 24 | Boone County (11), Jessamine County (4), Kenton County (4), Scott County (3) and Wayne County (2) |
| South Carolina | 32 | joint 28th of 40 | Barnwell County (10), Pickens County (5), Greenville County (4), Oconee County (3) and Lexington County (2) |
Top counties in the U.S.
| # | County | State | Records | Share of U.S. |
|---|---|---|---|---|
| 1 | Allegheny County | Pennsylvania | 138 | 6.4% |
| 2 | Westmoreland County | Pennsylvania | 116 | 5.4% |
| 3 | Washington County | Pennsylvania | 112 | 5.2% |
| 4 | Montgomery County | Ohio | 66 | 3.1% |
| 5 | Watauga County | North Carolina | 53 | 2.5% |
| 6 | Washtenaw County | Michigan | 42 | 2.0% |
| 7 | Orange County | North Carolina | 38 | 1.8% |
| 8 | Lauderdale County | Alabama | 32 | 1.5% |
| 9 | Marshall County | West Virginia | 28 | 1.3% |
| 10 | Armstrong County | Pennsylvania | 26 | 1.2% |
| 11 | Jasper County | Indiana | 25 | 1.2% |
| 12 | Brown County | Ohio | 25 | 1.2% |
| 13 | Chatham County | North Carolina | 24 | 1.1% |
| 14 | Wake County | North Carolina | 24 | 1.1% |
| 15 | Tazewell County | Virginia | 23 | 1.1% |
How recent are the queen snake records?
| Decade | Records | Share |
|---|---|---|
| 1840s | 3 | 0.1% |
| 1850s | 4 | 0.2% |
| 1860s | 2 | 0.1% |
| 1870s | 1 | 0.0% |
| 1880s | 4 | 0.2% |
| 1890s | 87 | 4.3% |
| 1900s | 74 | 3.6% |
| 1910s | 15 | 0.7% |
| 1920s | 41 | 2.0% |
| 1930s | 187 | 9.2% |
| 1940s | 370 | 18.2% |
| 1950s | 148 | 7.3% |
| 1960s | 283 | 13.9% |
| 1970s | 138 | 6.8% |
| 1980s | 279 | 13.7% |
| 1990s | 48 | 2.4% |
| 2000s | 32 | 1.6% |
| 2010s | 43 | 2.1% |
| 2020s | 272 | 13.4% |
Species recorded in the same counties
| Species | Shared counties |
|---|---|
| Eastern rat snake | 87 |
| Northern water snake | 86 |
| Common garter snake | 75 |
| Ring-necked snake | 70 |
| DeKay's brown snake | 69 |
| Eastern racer | 63 |
| Eastern copperhead venomous | 54 |
| Eastern milksnake | 53 |
Related species in the U.S.
GBIF records read 2026-11-05 (open these records on GBIF). Listed: any license. Counted: CC0/CC BY only. How we count.