Northern water snake (Nerodia sipedon)
The northern water snake is a non-venomous snake in the family Colubridae. GBIF holds 12,917 licensed U.S. records of it; it reaches our listing threshold in 36 states, most of all Virginia (1,435), North Carolina (1,281) and Ohio (1,271). Its observation records peak in May.
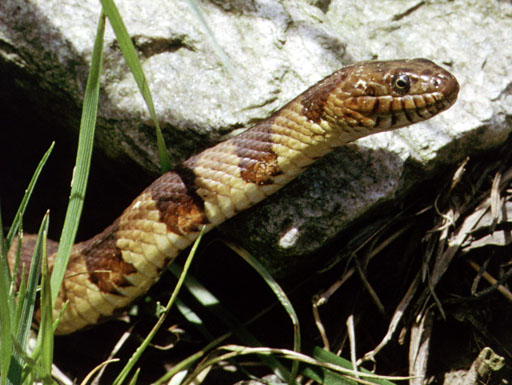

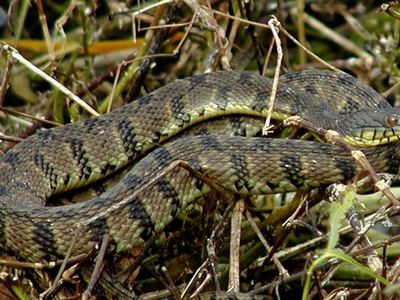
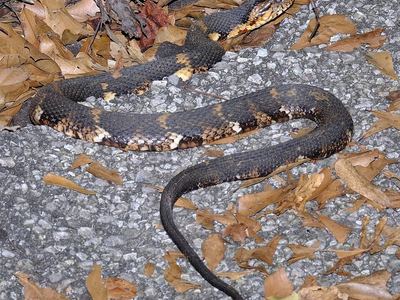
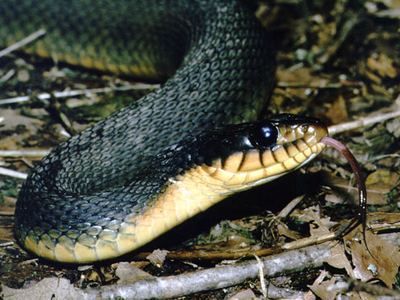
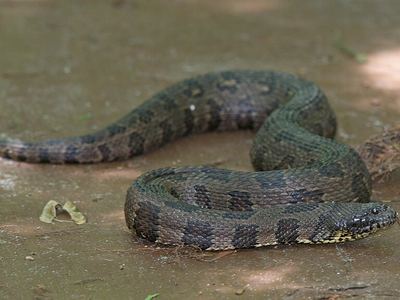
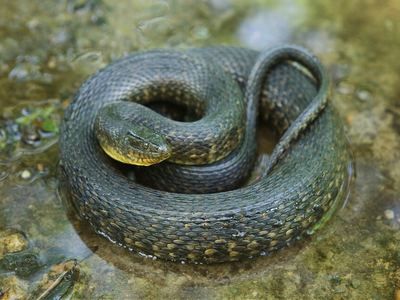
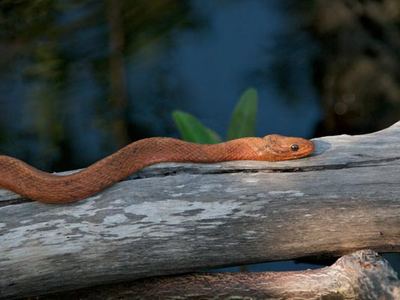
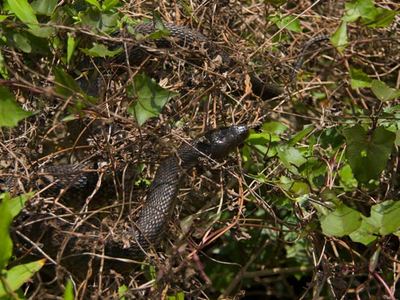
The common watersnake (Nerodia sipedon) is a species of large, nonvenomous, common snake in the family Colubridae. The species is native to North America. It is frequently mistaken for the venomous cottonmouth (Agkistrodon piscivorus).
From Wikipedia: Common watersnake, text under CC BY-SA 4.0.
Is the northern water snake poisonous or venomous?
No. The northern water snake is non-venomous: it belongs to the family Colubridae, not to the pit vipers or coral snakes, the only U.S. land snakes with medically dangerous venom. It may bite if handled; clean the bite like any small wound.
Often mistaken for
The northern water snake is non-venomous, but people often take it for copperheads (both are recorded in 27 of its 36 states) and cottonmouths (both are recorded in 16 of its 36 states).
Which states have the northern water snake?
Records are spread over 36 states; the top three, Virginia, North Carolina and Ohio, hold 31% of them. It is the most recorded snake of all in Virginia, Alabama, Maryland, Indiana, West Virginia and Delaware.
| # | State | Records | Share of state snakes | Rank in state |
|---|---|---|---|---|
| 1 | Virginia | 1,435 | 13.1% | 1st of 30 |
| 2 | North Carolina | 1,281 | 6.2% | 5th of 39 |
| 3 | Ohio | 1,271 | 20.8% | 2nd of 25 |
| 4 | Kansas | 1,214 | 8.2% | 2nd of 44 |
| 5 | Alabama | 916 | 15.9% | 1st of 44 |
| 6 | New York | 903 | 15.1% | 2nd of 17 |
| 7 | Pennsylvania | 859 | 10.1% | 3rd of 20 |
| 8 | Maryland | 589 | 16.3% | 1st of 20 |
| 9 | Michigan | 584 | 11.3% | 2nd of 17 |
| 10 | Indiana | 394 | 17.9% | 1st of 27 |
| 11 | Massachusetts | 347 | 17.7% | 2nd of 13 |
| 12 | Tennessee | 328 | 12.5% | 2nd of 32 |
| 13 | West Virginia | 288 | 17.6% | 1st of 18 |
| 14 | Delaware | 262 | 38.9% | 1st of 14 |
| 15 | Illinois | 243 | 8.7% | 5th of 33 |
| 16 | New Jersey | 219 | 19.4% | 2nd of 18 |
| 17 | Georgia | 204 | 3.3% | 5th of 44 |
| 18 | Missouri | 202 | 10.7% | 2nd of 36 |
| 19 | Oklahoma | 184 | 1.4% | 24th of 50 |
| 20 | Connecticut | 152 | 13.1% | 2nd of 14 |
| 21 | Florida | 104 | 0.5% | 29th of 49 |
| 22 | Iowa | 104 | 9.9% | 3rd of 22 |
| 23 | Arkansas | 102 | 1.9% | 10th of 36 |
| 24 | Kentucky | 102 | 8.0% | 4th of 24 |
| 25 | Nebraska | 82 | 3.5% | 8th of 31 |
| 26 | South Carolina | 82 | 2.3% | 21st of 40 |
| 27 | Wisconsin | 80 | 8.1% | 2nd of 16 |
| 28 | New Hampshire | 71 | 12.2% | 2nd of 9 |
| 29 | Mississippi | 67 | 3.6% | 10th of 38 |
| 30 | Rhode Island | 65 | 32.5% | 2nd of 10 |
| 31 | Maine | 47 | 5.4% | 4th of 9 |
| 32 | Colorado | 42 | 1.2% | 10th of 26 |
| 33 | Louisiana | 26 | 0.5% | 27th of 41 |
| 34 | Vermont | 21 | 1.9% | 5th of 9 |
| 35 | Texas | 19 | 0.0% | 79th of 86 |
| 36 | Minnesota | 18 | 2.0% | 10th of 15 |
When is the northern water snake seen?
Across the U.S., observation records of the northern water snake run mostly April through September, peaking in May with 28% of them. Almost none are from December to February.
Season by state
Among states whose main season falls within one calendar year, it starts earliest in March (Delaware, Georgia, Kentucky, North Carolina, South Carolina and Tennessee) and latest in May (West Virginia and Wisconsin). The most common peak month is May, shared by Alabama, Connecticut, Delaware, Illinois, Indiana, Kansas and 11 more.
| State | Main season | Peak month | Observation records |
|---|---|---|---|
| Ohio | April through September | May | 651 |
| New York | April through August | May | 599 |
| Virginia | April through September | May | 503 |
| North Carolina | March through September | May | 478 |
| Maryland | April through October | May | 331 |
| Massachusetts | April through September | May | 312 |
| Pennsylvania | April through August | May | 294 |
| Tennessee | March through September | April | 248 |
| Delaware | March through September | May | 238 |
| Missouri | April through September | May | 152 |
| Illinois | April through September | May | 151 |
| Georgia | March through August | April | 148 |
| New Jersey | April through September | April | 140 |
| Indiana | April through September | May | 132 |
| Michigan | April through September | May | 124 |
| Connecticut | April through September | May | 74 |
| Kentucky | March through August | May | 74 |
| Kansas | April through September | May | 73 |
| New Hampshire | April through September | July | 65 |
| Alabama | April through November | May | 62 |
| Arkansas | April through October | April | 60 |
| Wisconsin | May through September | May | 60 |
| West Virginia | May through September | June | 50 |
| South Carolina | March through September | April | 36 |
Where the northern water snake is recorded in each state
Virginia
Virginia holds 1,435 licensed records, the most recorded of 30 snakes listed there. Its observation records in Virginia run mostly April through September, peaking in May; most licensed records come from Fairfax County, Russell County and Charles City County. Next come Henrico County (71) and Richmond (58).
North Carolina
North Carolina holds 1,281 licensed records, the 5th most recorded of 39 snakes listed there. Its observation records in North Carolina run mostly March through September, peaking in May; most licensed records come from Wake County, Orange County and Dare County. Next come Macon County (62) and Chatham County (53).
Ohio
Ohio holds 1,271 licensed records, the 2nd most recorded of 25 snakes listed there. Its observation records in Ohio run mostly April through September, peaking in May; most licensed records come from Ottawa County, Lucas County and Summit County. Next come Erie County (81) and Scioto County (68).
Kansas
Kansas holds 1,214 licensed records, the 2nd most recorded of 44 snakes listed there. Its observation records in Kansas run mostly April through September, peaking in May; most licensed records come from Chase County, Douglas County and Jefferson County. Next come Ellis County (41) and Greenwood County (39).
Alabama
Alabama holds 916 licensed records, the most recorded of 44 snakes listed there. Its observation records in Alabama run mostly April through November, peaking in May; most licensed records come from Geneva County, Henry County and Lee County. Next come Escambia County (56) and DeKalb County (55).
New York
New York holds 903 licensed records, the 2nd most recorded of 17 snakes listed there. Its observation records in New York run mostly April through August, peaking in May; most licensed records come from Ulster County, Tompkins County and Onondaga County. Next come Suffolk County (55) and Broome County (33).
Pennsylvania
Pennsylvania holds 859 licensed records, the 3rd most recorded of 20 snakes listed there. Its observation records in Pennsylvania run mostly April through August, peaking in May; most licensed records come from Allegheny County, Erie County and Westmoreland County. Next come Venango County (40) and Bucks County (40).
Maryland
Maryland holds 589 licensed records, the most recorded of 20 snakes listed there. Its observation records in Maryland run mostly April through October, peaking in May; most licensed records come from Prince George's County, Montgomery County and Garrett County. Next come Anne Arundel County (45) and Frederick County (42).
Michigan
Michigan holds 584 licensed records, the 2nd most recorded of 17 snakes listed there. Its observation records in Michigan run mostly April through September, peaking in May; most licensed records come from Cheboygan County, Isabella County and Charlevoix County. Next come Washtenaw County (37) and Oakland County (26).
Indiana
Indiana holds 394 licensed records, the most recorded of 27 snakes listed there. Its observation records in Indiana run mostly April through September, peaking in May; most licensed records come from Morgan County, Porter County and Marshall County. Next come Monroe County (21) and Marion County (16).
Massachusetts
Massachusetts holds 347 licensed records, the 2nd most recorded of 13 snakes listed there. Its observation records in Massachusetts run mostly April through September, peaking in May; most licensed records come from Middlesex County, Worcester County and Essex County. Next come Norfolk County (33) and Plymouth County (23).
Tennessee
Tennessee holds 328 licensed records, the 2nd most recorded of 32 snakes listed there. Its observation records in Tennessee run mostly March through September, peaking in April; most licensed records come from Cheatham County, Montgomery County and Sevier County. Next come Davidson County (25) and Blount County (20).
West Virginia
West Virginia holds 288 licensed records, the most recorded of 18 snakes listed there. Its observation records in West Virginia run mostly May through September, peaking in June; most licensed records come from Randolph County, Pocahontas County and Preston County. Next come Tucker County (15) and Greenbrier County (14).
Delaware
Delaware holds 262 licensed records, the most recorded of 14 snakes listed there. Its observation records in Delaware run mostly March through September, peaking in May; most licensed records come from Sussex County, Kent County and New Castle County.
Illinois
Illinois holds 243 licensed records, the 5th most recorded of 33 snakes listed there. Its observation records in Illinois run mostly April through September, peaking in May; most licensed records come from DuPage County, Cook County and Will County. Next come St. Clair County (17) and Champaign County (16).
New Jersey
New Jersey holds 219 licensed records, the 2nd most recorded of 18 snakes listed there. Its observation records in New Jersey run mostly April through September, peaking in April; most licensed records come from Morris County, Atlantic County and Burlington County. Next come Cape May County (18) and Sussex County (13).
Georgia
Georgia holds 204 licensed records, the 5th most recorded of 44 snakes listed there. Its observation records in Georgia run mostly March through August, peaking in April; most licensed records come from DeKalb County, Clarke County and Cobb County. Next come Fulton County (10) and Gwinnett County (9).
Missouri
Missouri holds 202 licensed records, the 2nd most recorded of 36 snakes listed there. Its observation records in Missouri run mostly April through September, peaking in May; most licensed records come from St. Louis County, Texas County and Dent County. Next come Holt County (13) and St. Charles County (12).
Oklahoma
Oklahoma holds 184 licensed records, the 24th most recorded of 50 snakes listed there. Most of its licensed records in Oklahoma come from LeFlore County, Delaware County and Cherokee County. Next come McCurtain County (20) and Adair County (13).
Connecticut
Connecticut holds 152 licensed records, the 2nd most recorded of 14 snakes listed there. Its observation records in Connecticut run mostly April through September, peaking in May; most licensed records come from New Haven County, Middlesex County and Litchfield County. Next come New London County (19) and Fairfield County (18).
Florida
Florida holds 104 licensed records, the 29th most recorded of 49 snakes listed there. Most of its licensed records in Florida come from Miami-Dade County, Collier County and Lee County. Next come Monroe County (5) and Sarasota County (4).
Iowa
Iowa holds 104 licensed records, the 3rd most recorded of 22 snakes listed there. Most of its licensed records in Iowa come from Adams County, Johnson County and Polk County. Next come Linn County (5) and Allamakee County (4).
Arkansas
Arkansas holds 102 licensed records, the 10th most recorded of 36 snakes listed there. Its observation records in Arkansas run mostly April through October, peaking in April; most licensed records come from Benton County, Washington County and Madison County. Next come Polk County (9) and Carroll County (7).
Kentucky
Kentucky holds 102 licensed records, the joint 4th most recorded of 24 snakes listed there. Its observation records in Kentucky run mostly March through August, peaking in May; most licensed records come from Madison County, Kenton County and Campbell County. Next come Pulaski County (3) and Bullitt County (3).
Nebraska
Nebraska holds 82 licensed records, the 8th most recorded of 31 snakes listed there. Most of its licensed records in Nebraska come from Gage County, Cass County and Lancaster County. Next come Jefferson County (5) and Saunders County (5).
Top counties in the U.S.
| # | County | State | Records | Share of U.S. |
|---|---|---|---|---|
| 1 | Chase County | Kansas | 493 | 3.8% |
| 2 | Wake County | North Carolina | 286 | 2.2% |
| 3 | Ulster County | New York | 263 | 2.0% |
| 4 | Sussex County | Delaware | 185 | 1.4% |
| 5 | Fairfax County | Virginia | 178 | 1.4% |
| 6 | Ottawa County | Ohio | 146 | 1.1% |
| 7 | Russell County | Virginia | 143 | 1.1% |
| 8 | Prince George's County | Maryland | 124 | 1.0% |
| 9 | Tompkins County | New York | 122 | 0.9% |
| 10 | Geneva County | Alabama | 116 | 0.9% |
| 11 | Charles City County | Virginia | 109 | 0.8% |
| 12 | Orange County | North Carolina | 98 | 0.8% |
| 13 | Montgomery County | Maryland | 97 | 0.8% |
| 14 | Allegheny County | Pennsylvania | 97 | 0.8% |
| 15 | Douglas County | Kansas | 95 | 0.7% |
How recent are the northern water snake records?
The northern water snake record leans on older material: only 40% of dated U.S. records come from 2017–2026, and the median record is from 1987. The oldest dated record is from 1853; the busiest year was 2025, with 777 records.
| Decade | Records | Share |
|---|---|---|
| 1850s | 4 | 0.0% |
| 1860s | 12 | 0.1% |
| 1870s | 15 | 0.1% |
| 1880s | 82 | 0.7% |
| 1890s | 121 | 1.0% |
| 1900s | 200 | 1.6% |
| 1910s | 193 | 1.6% |
| 1920s | 255 | 2.1% |
| 1930s | 1,001 | 8.1% |
| 1940s | 660 | 5.3% |
| 1950s | 671 | 5.4% |
| 1960s | 1,364 | 11.0% |
| 1970s | 926 | 7.5% |
| 1980s | 874 | 7.1% |
| 1990s | 350 | 2.8% |
| 2000s | 358 | 2.9% |
| 2010s | 972 | 7.8% |
| 2020s | 4,334 | 35.0% |
Species recorded in the same counties
Of the 435 counties where the northern water snake is most recorded, 245 are also top counties for the common garter snake, more than for any other snake. Venomous species among its neighbors: the eastern copperhead.
| Species | Shared counties |
|---|---|
| Common garter snake | 245 |
| DeKay's brown snake | 197 |
| Eastern racer | 197 |
| Ring-necked snake | 187 |
| Eastern rat snake | 154 |
| Eastern milksnake | 142 |
| Eastern copperhead venomous | 122 |
| Red-bellied snake | 119 |
Related species in the U.S.
Other species of the genus Nerodia with profiles here: Diamondback water snake, Southern watersnake, Plain-bellied watersnake, Brown water snake, Green water snake, Salt marsh snake and Florida green water snake.
GBIF records read 2026-09-29. Listed: any license. Counted: CC0/CC BY only. How we count.