Red-bellied snake (Storeria occipitomaculata)
The red-bellied snake is a non-venomous snake in the family Colubridae. GBIF holds 3,197 licensed U.S. records of it; it reaches our listing threshold in 35 states, most of all North Carolina (468), Pennsylvania (465) and Michigan (399). Its observation records peak in July.
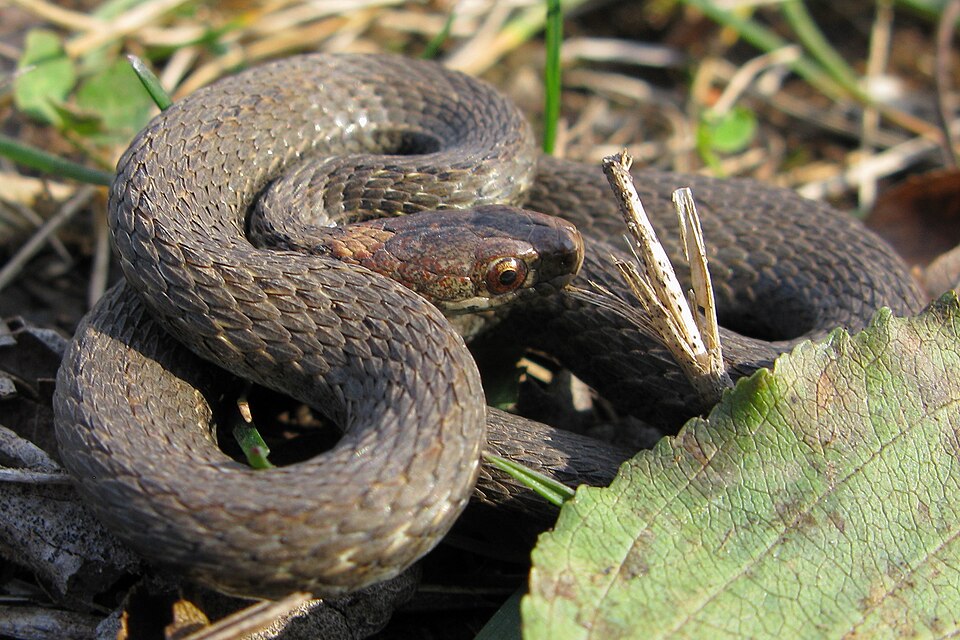

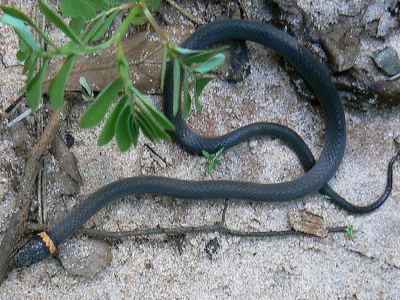
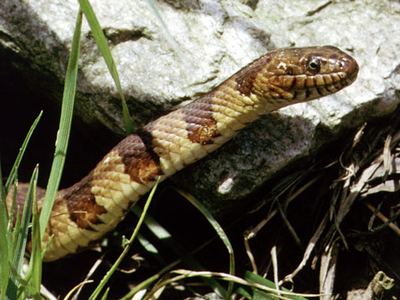
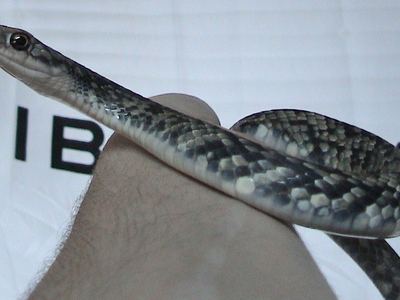
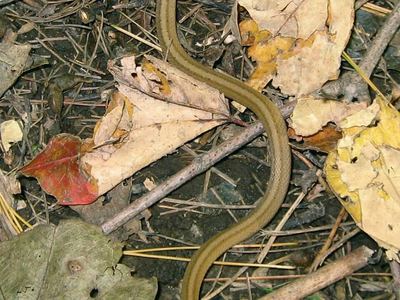
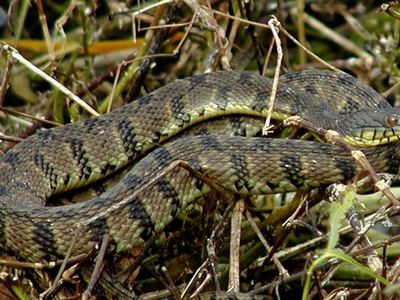
Storeria occipitomaculata, commonly known as the redbelly snake or the red-bellied snake, is a species of harmless snake in the subfamily Natricinae of the family Colubridae. The species is native to North America (Canada and the United States).
From Wikipedia: Storeria occipitomaculata, text under CC BY-SA 4.0.
Is the red-bellied snake poisonous or venomous?
No. The red-bellied snake is non-venomous: it belongs to the family Colubridae, not to the pit vipers or coral snakes, the only U.S. land snakes with medically dangerous venom. It may bite if handled; clean the bite like any small wound.
Which states have the red-bellied snake?
Records are spread over 35 states; the top three, North Carolina, Pennsylvania and Michigan, hold 42% of them.
| # | State | Records | Share of state snakes | Rank in state |
|---|---|---|---|---|
| 1 | North Carolina | 468 | 2.3% | 18th of 39 |
| 2 | Pennsylvania | 465 | 5.5% | 9th of 20 |
| 3 | Michigan | 399 | 7.7% | 3rd of 17 |
| 4 | New York | 270 | 4.5% | 6th of 17 |
| 5 | Virginia | 161 | 1.5% | 19th of 30 |
| 6 | Minnesota | 141 | 15.3% | 2nd of 15 |
| 7 | Maine | 132 | 15.1% | 2nd of 9 |
| 8 | Ohio | 124 | 2.0% | 10th of 25 |
| 9 | Alabama | 101 | 1.8% | 22nd of 44 |
| 10 | South Dakota | 99 | 3.1% | 8th of 16 |
| 11 | South Carolina | 98 | 2.7% | 15th of 40 |
| 12 | Georgia | 91 | 1.5% | 15th of 44 |
| 13 | Wisconsin | 73 | 7.4% | 4th of 16 |
| 14 | West Virginia | 58 | 3.5% | 10th of 18 |
| 15 | Vermont | 57 | 5.0% | 3rd of 9 |
| 16 | Illinois | 42 | 1.5% | 19th of 33 |
| 17 | Arkansas | 37 | 0.7% | 19th of 36 |
| 18 | Maryland | 37 | 1.0% | 16th of 20 |
| 19 | Florida | 35 | 0.2% | 39th of 49 |
| 20 | Massachusetts | 32 | 1.6% | 9th of 13 |
| 21 | New Hampshire | 31 | 5.3% | 4th of 9 |
| 22 | Kansas | 27 | 0.2% | 38th of 44 |
| 23 | Kentucky | 27 | 2.1% | 15th of 24 |
| 24 | Texas | 27 | 0.1% | 75th of 86 |
| 25 | Oklahoma | 24 | 0.2% | 47th of 50 |
| 26 | Tennessee | 22 | 0.8% | 23rd of 32 |
| 27 | New Jersey | 19 | 1.7% | 13th of 18 |
| 28 | Louisiana | 18 | 0.4% | 31st of 41 |
| 29 | Missouri | 17 | 0.9% | 25th of 36 |
| 30 | Mississippi | 16 | 0.9% | 27th of 38 |
| 31 | Indiana | 14 | 0.6% | 23rd of 27 |
| 32 | Connecticut | 12 | 1.0% | 14th of 14 |
| 33 | Iowa | 9 | 0.9% | 20th of 22 |
| 34 | North Dakota | 6 | 2.8% | 7th of 8 |
| 35 | Nebraska | 4 | 0.2% | 31st of 31 |
When is the red-bellied snake seen?
Across the U.S., observation records of the red-bellied snake run mostly April through November, peaking in July with 16% of them. Winter (December to February) holds 2% of them.
Season by state
Among states whose main season falls within one calendar year, it starts earliest in March (Georgia) and latest in May (Michigan, Minnesota, Ohio and Pennsylvania). The most common peak months are September and October, each shared by three states.
| State | Main season | Peak month | Observation records |
|---|---|---|---|
| Minnesota | May through October | October | 96 |
| Ohio | May through October | July | 78 |
| North Carolina | April through November | September | 70 |
| Georgia | March through November | October | 57 |
| Pennsylvania | May through September | July | 52 |
| Maine | April through October | June | 48 |
| New York | April through October | September | 44 |
| Wisconsin | April through October | October | 43 |
| Vermont | April through September | September | 42 |
| Virginia | April through November | May | 42 |
| Michigan | May through October | June | 35 |
Where the red-bellied snake is recorded in each state
North Carolina
North Carolina holds 468 licensed records, the 18th most recorded of 39 snakes listed there. Its observation records in North Carolina run mostly April through November, peaking in September; most licensed records come from New Hanover County, Moore County and Wake County. Next come Sampson County (27) and Brunswick County (23).
Pennsylvania
Pennsylvania holds 465 licensed records, the 9th most recorded of 20 snakes listed there. Its observation records in Pennsylvania run mostly May through September, peaking in July; most licensed records come from Warren County, Potter County and Forest County. Next come McKean County (33) and Jefferson County (20).
Michigan
Michigan holds 399 licensed records, the 3rd most recorded of 17 snakes listed there. Its observation records in Michigan run mostly May through October, peaking in June; most licensed records come from Gogebic County, Schoolcraft County and Ontonagon County. Next come Washtenaw County (24) and Cheboygan County (22).
New York
New York holds 270 licensed records, the 6th most recorded of 17 snakes listed there. Its observation records in New York run mostly April through October, peaking in September; most licensed records come from Tompkins County, Chemung County and Cattaraugus County. Next come Erie County (14) and Chautauqua County (12).
Virginia
Virginia holds 161 licensed records, the 19th most recorded of 30 snakes listed there. Its observation records in Virginia run mostly April through November, peaking in May; most licensed records come from Highland County, Henrico County and Augusta County. Next come Chesterfield County (10) and Powhatan County (10).
Minnesota
Minnesota holds 141 licensed records, the 2nd most recorded of 15 snakes listed there. Its observation records in Minnesota run mostly May through October, peaking in October; most licensed records come from Crow Wing County, Rice County and St. Louis County. Next come Anoka County (9) and Lake County (9).
Maine
Maine holds 132 licensed records, the 2nd most recorded of 9 snakes listed there. Its observation records in Maine run mostly April through October, peaking in June; most licensed records come from Hancock County, Penobscot County and Somerset County. Next come Washington County (10) and Kennebec County (8).
Ohio
Ohio holds 124 licensed records, the 10th most recorded of 25 snakes listed there. Its observation records in Ohio run mostly May through October, peaking in July; most licensed records come from Summit County, Cuyahoga County and Scioto County. Next come Defiance County (4) and Pike County (3).
Alabama
Alabama holds 101 licensed records, the 22nd most recorded of 44 snakes listed there. Most of its licensed records in Alabama come from Lee County, Macon County and Baldwin County. Next come Bibb County (6) and Madison County (4).
South Dakota
South Dakota holds 99 licensed records, the 8th most recorded of 16 snakes listed there. Most of its licensed records in South Dakota come from Lincoln County, Hutchinson County and Custer County. Next come Lawrence County (8) and Pennington County (8).
South Carolina
South Carolina holds 98 licensed records, the 15th most recorded of 40 snakes listed there. Most of its licensed records in South Carolina come from Berkeley County, Charleston County and Chesterfield County. Next come Anderson County (7) and Georgetown County (4).
Georgia
Georgia holds 91 licensed records, the 15th most recorded of 44 snakes listed there. Its observation records in Georgia run mostly March through November, peaking in October; most licensed records come from Clarke County, Rabun County and Oglethorpe County. Next come Bulloch County (5) and Greene County (5).
Wisconsin
Wisconsin holds 73 licensed records, the 4th most recorded of 16 snakes listed there. Its observation records in Wisconsin run mostly April through October, peaking in October; most licensed records come from Dane County, Waukesha County and Juneau County. Next come Sauk County (5) and Vilas County (5).
West Virginia
West Virginia holds 58 licensed records, the 10th most recorded of 18 snakes listed there. Most of its licensed records in West Virginia come from Pocahontas County, Randolph County and Tucker County. Next come Pendleton County (6) and Preston County (6).
Vermont
Vermont holds 57 licensed records, the 3rd most recorded of 9 snakes listed there. Its observation records in Vermont run mostly April through September, peaking in September; most licensed records come from Lamoille County, Washington County and Rutland County. Next come Chittenden County (5) and Windham County (4).
Illinois
Illinois holds 42 licensed records, the 19th most recorded of 33 snakes listed there. Most of its licensed records in Illinois come from St. Clair County, Richland County and Cook County. Next come Macoupin County (4) and Union County (4).
Arkansas
Arkansas holds 37 licensed records, the 19th most recorded of 36 snakes listed there. Most of its licensed records in Arkansas come from Scott County, Columbia County and Washington County. Next come Montgomery County (3) and Pulaski County (3).
Maryland
Maryland holds 37 licensed records, the joint 16th most recorded of 20 snakes listed there. Most of its licensed records in Maryland come from Garrett County, Prince George's County and Allegany County. Next come Wicomico County (3) and Montgomery County (2).
Florida
Florida holds 35 licensed records, the 39th most recorded of 49 snakes listed there. Most of its licensed records in Florida come from Alachua County, Liberty County and Santa Rosa County. Next come Escambia County (3) and Leon County (2).
Massachusetts
Massachusetts holds 32 licensed records, the 9th most recorded of 13 snakes listed there. Most of its licensed records in Massachusetts come from Worcester County, Barnstable County and Hampshire County. Next come Dukes County (3) and Franklin County (3).
New Hampshire
New Hampshire holds 31 licensed records, the 4th most recorded of 9 snakes listed there. Most of its licensed records in New Hampshire come from Cheshire County, Coos County and Grafton County. Next come Hillsborough County (5) and Sullivan County (4).
Top counties in the U.S.
| # | County | State | Records | Share of U.S. |
|---|---|---|---|---|
| 1 | Warren County | Pennsylvania | 86 | 2.7% |
| 2 | Tompkins County | New York | 82 | 2.6% |
| 3 | Hancock County | Maine | 49 | 1.5% |
| 4 | Potter County | Pennsylvania | 49 | 1.5% |
| 5 | New Hanover County | North Carolina | 48 | 1.5% |
| 6 | Summit County | Ohio | 47 | 1.5% |
| 7 | Moore County | North Carolina | 37 | 1.2% |
| 8 | Wake County | North Carolina | 35 | 1.1% |
| 9 | Forest County | Pennsylvania | 33 | 1.0% |
| 10 | McKean County | Pennsylvania | 33 | 1.0% |
| 11 | Gogebic County | Michigan | 32 | 1.0% |
| 12 | Schoolcraft County | Michigan | 27 | 0.8% |
| 13 | Sampson County | North Carolina | 27 | 0.8% |
| 14 | Cuyahoga County | Ohio | 27 | 0.8% |
| 15 | Ontonagon County | Michigan | 26 | 0.8% |
How recent are the red-bellied snake records?
The red-bellied snake record leans on older material: only 30% of dated U.S. records come from 2017–2026, and the median record is from 1985. The oldest dated record is from 1853; the busiest year was 2023, with 148 records.
| Decade | Records | Share |
|---|---|---|
| 1850s | 1 | 0.0% |
| 1860s | 12 | 0.4% |
| 1870s | 9 | 0.3% |
| 1880s | 4 | 0.1% |
| 1890s | 48 | 1.5% |
| 1900s | 49 | 1.6% |
| 1910s | 51 | 1.6% |
| 1920s | 49 | 1.6% |
| 1930s | 227 | 7.3% |
| 1940s | 240 | 7.7% |
| 1950s | 231 | 7.4% |
| 1960s | 256 | 8.2% |
| 1970s | 280 | 9.0% |
| 1980s | 246 | 7.9% |
| 1990s | 124 | 4.0% |
| 2000s | 128 | 4.1% |
| 2010s | 374 | 12.0% |
| 2020s | 781 | 25.1% |
Species recorded in the same counties
Of the 295 counties where the red-bellied snake is most recorded, 166 are also top counties for the common garter snake, more than for any other snake. None of its closest neighbors is venomous.
| Species | Shared counties |
|---|---|
| Common garter snake | 166 |
| Ring-necked snake | 133 |
| Northern water snake | 119 |
| DeKay's brown snake | 108 |
| Eastern racer | 104 |
| Eastern rat snake | 99 |
| Eastern milksnake | 86 |
| Rough greensnake | 76 |
Related species in the U.S.
Other species of the genus Storeria with profiles here: DeKay's brown snake.
GBIF records read 2026-09-29. Listed: any license. Counted: CC0/CC BY only. How we count.