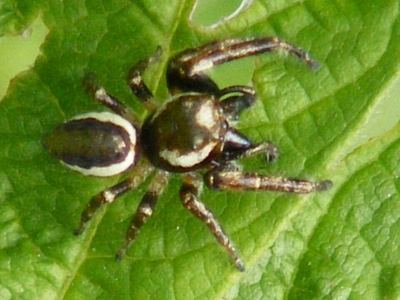
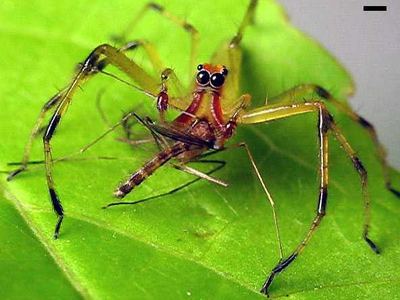
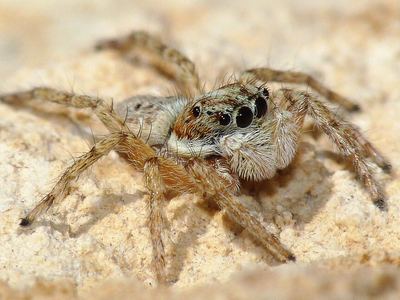
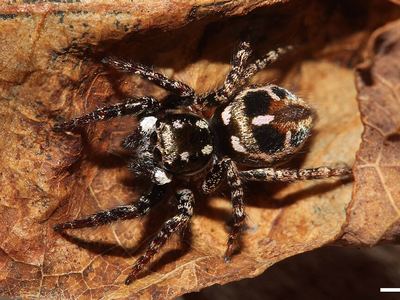
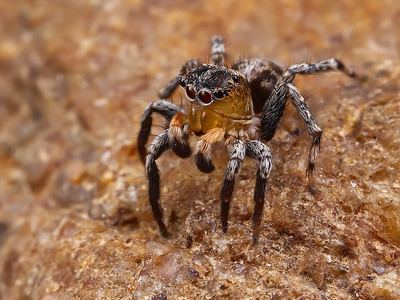
Peppered jumper (Pelegrina galathea)
The peppered jumper is a spider in the family Salticidae that is not dangerous to people. GBIF holds 1,114 licensed U.S. records of it; it reaches our listing threshold in 33 states, most of all Texas (158), Virginia (106) and Pennsylvania (81). Its observation records peak in June.
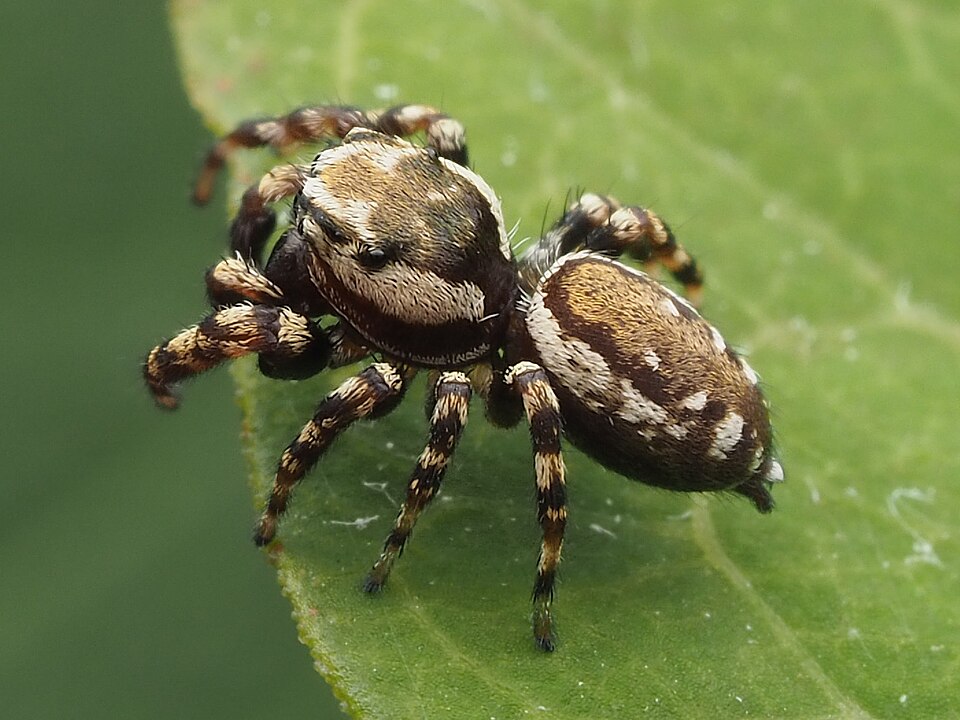

Pelegrina galathea, commonly known as the peppered jumper, is a species of jumping spider (family Salticidae). It is endemic to North America, occurring from Canada to Costa Rica. It is normally found in sunlit, grassy areas.
From Wikipedia: Pelegrina galathea, text under CC BY-SA 4.0.
Is the peppered jumper poisonous or venomous?
Not in any medically significant way. Like almost all spiders the peppered jumper (family Salticidae) has venom for its prey, but it is not a widow or recluse, the two U.S. groups whose bites need medical attention.
Which states have the peppered jumper?
Records are spread over 33 states; the top three, Texas, Virginia and Pennsylvania, hold 31% of them.
| # | State | Records | Share of state spiders | Rank in state |
|---|---|---|---|---|
| 1 | Texas | 158 | 0.5% | 35th of 386 |
| 2 | Virginia | 106 | 0.9% | 29th of 176 |
| 3 | Pennsylvania | 81 | 1.1% | 18th of 164 |
| 4 | New York | 79 | 1.3% | 20th of 149 |
| 5 | Georgia | 73 | 1.1% | 22nd of 186 |
| 6 | Maryland | 65 | 1.1% | 22nd of 153 |
| 7 | Ohio | 61 | 0.9% | 26th of 332 |
| 8 | Illinois | 56 | 0.3% | 51st of 243 |
| 9 | Oklahoma | 46 | 0.9% | 24th of 149 |
| 10 | Tennessee | 44 | 1.2% | 20th of 138 |
| 11 | North Carolina | 41 | 0.5% | 47th of 184 |
| 12 | Colorado | 36 | 0.9% | 17th of 378 |
| 13 | Indiana | 34 | 0.8% | 26th of 133 |
| 14 | Florida | 27 | 0.2% | 68th of 237 |
| 15 | Massachusetts | 25 | 0.5% | 41st of 189 |
| 16 | Alabama | 23 | 0.6% | 40th of 143 |
| 17 | New Jersey | 18 | 0.8% | 33rd of 127 |
| 18 | Louisiana | 17 | 0.4% | 46th of 107 |
| 19 | Delaware | 16 | 0.8% | 37th of 71 |
| 20 | Kentucky | 16 | 0.9% | 31st of 103 |
| 21 | Missouri | 15 | 0.6% | 32nd of 117 |
| 22 | Kansas | 13 | 0.8% | 24th of 94 |
| 23 | Michigan | 12 | 0.5% | 37th of 122 |
| 24 | Wisconsin | 11 | 0.4% | 69th of 149 |
| 25 | South Carolina | 9 | 0.4% | 53rd of 121 |
| 26 | Arkansas | 6 | 0.4% | 66th of 114 |
| 27 | Mississippi | 5 | 0.4% | 52nd of 117 |
| 28 | West Virginia | 5 | 0.7% | 30th of 90 |
| 29 | Connecticut | 3 | 0.3% | 49th of 86 |
| 30 | Nebraska | 3 | 0.2% | 57th of 71 |
| 31 | Rhode Island | 2 | 1.2% | 21st of 53 |
| 32 | Maine | 1 | 0.1% | 61st of 297 |
| 33 | Iowa | 0 | — | — |
When is the peppered jumper seen?
Across the U.S., observation records of the peppered jumper run mostly April through October, peaking in June with 24% of them. Almost none are from December to February.
Season by state
Among states whose main season falls within one calendar year, it starts earliest in March (Oklahoma) and latest in May (Colorado, Illinois, Maryland, New York, Ohio and Virginia). The most common peak month is June, shared by Colorado, Illinois, Maryland, New York, Ohio and Pennsylvania.
| State | Main season | Peak month | Observation records |
|---|---|---|---|
| Texas | April through November | May | 151 |
| Virginia | May through October | September | 106 |
| New York | May through September | June | 79 |
| Georgia | April through October | July | 73 |
| Pennsylvania | April through September | June | 68 |
| Maryland | May through October | June | 65 |
| Ohio | May through September | June | 61 |
| Tennessee | April through September | July | 43 |
| North Carolina | April through September | July | 41 |
| Colorado | May through July | June | 36 |
| Illinois | May through October | June | 33 |
| Oklahoma | March through October | October | 30 |
Where the peppered jumper is recorded in each state
Texas
Texas holds 158 licensed records, the 35th most recorded of 386 spiders listed there. Its observation records in Texas run mostly April through November, peaking in May; most licensed records come from Tarrant County, Travis County and Erath County. Next come Harris County (10) and Dallas County (10).
Virginia
Virginia holds 106 licensed records, the 29th most recorded of 176 spiders listed there. Its observation records in Virginia run mostly May through October, peaking in September; most licensed records come from Fairfax County, Hanover County and Prince William County. Next come Loudoun County (6) and Chesterfield County (3).
Pennsylvania
Pennsylvania holds 81 licensed records, the 18th most recorded of 164 spiders listed there. Its observation records in Pennsylvania run mostly April through September, peaking in June; most licensed records come from Westmoreland County, Allegheny County and Philadelphia County. Next come Butler County (9) and Bucks County (9).
New York
New York holds 79 licensed records, the 20th most recorded of 149 spiders listed there. Its observation records in New York run mostly May through September, peaking in June; most licensed records come from Westchester County, Tompkins County and Rockland County. Next come Kings County (9) and Bronx County (7).
Georgia
Georgia holds 73 licensed records, the 22nd most recorded of 186 spiders listed there. Its observation records in Georgia run mostly April through October, peaking in July; most licensed records come from Clarke County, Gwinnett County and DeKalb County. Next come Cherokee County (2) and Jones County (2).
Maryland
Maryland holds 65 licensed records, the 22nd most recorded of 153 spiders listed there. Its observation records in Maryland run mostly May through October, peaking in June; most licensed records come from Harford County, Prince George's County and Baltimore County. Next come Montgomery County (8) and Anne Arundel County (6).
Ohio
Ohio holds 61 licensed records, the 26th most recorded of 332 spiders listed there. Its observation records in Ohio run mostly May through September, peaking in June; most licensed records come from Franklin County, Hamilton County and Cuyahoga County. Next come Summit County (6) and Clermont County (5).
Illinois
Illinois holds 56 licensed records, the joint 51st most recorded of 243 spiders listed there. Its observation records in Illinois run mostly May through October, peaking in June; most licensed records come from Cook County, Champaign County and Jo Daviess County. Next come Madison County (6) and Lake County (5).
Oklahoma
Oklahoma holds 46 licensed records, the joint 24th most recorded of 149 spiders listed there. Its observation records in Oklahoma run mostly March through October, peaking in October; most licensed records come from Marshall County, Oklahoma County and Cleveland County. Next come Woodward County (6) and Osage County (4).
Tennessee
Tennessee holds 44 licensed records, the 20th most recorded of 138 spiders listed there. Its observation records in Tennessee run mostly April through September, peaking in July; most licensed records come from Knox County, Blount County and Hamilton County. Next come Bradley County (3) and Williamson County (3).
North Carolina
North Carolina holds 41 licensed records, the joint 47th most recorded of 184 spiders listed there. Its observation records in North Carolina run mostly April through September, peaking in July; most licensed records come from Cumberland County, Orange County and Mecklenburg County. Next come Alamance County (3) and Durham County (2).
Colorado
Colorado holds 36 licensed records, the 17th most recorded of 378 spiders listed there. Its observation records in Colorado run mostly May through July, peaking in June; most licensed records come from El Paso County, Larimer County and Boulder County. Next come Douglas County (3) and Fremont County (2).
Indiana
Indiana holds 34 licensed records, the joint 26th most recorded of 133 spiders listed there. Most of its licensed records in Indiana come from Lake County, Monroe County and Newton County. Next come Delaware County (1) and Allen County (1).
Top counties in the U.S.
| # | County | State | Records | Share of U.S. |
|---|---|---|---|---|
| 1 | Fairfax County | Virginia | 67 | 6.0% |
| 2 | Clarke County | Georgia | 44 | 3.9% |
| 3 | Tarrant County | Texas | 27 | 2.4% |
| 4 | Lake County | Indiana | 20 | 1.8% |
| 5 | Knox County | Tennessee | 20 | 1.8% |
| 6 | Westchester County | New York | 18 | 1.6% |
| 7 | El Paso County | Colorado | 16 | 1.4% |
| 8 | Harford County | Maryland | 16 | 1.4% |
| 9 | Prince George's County | Maryland | 16 | 1.4% |
| 10 | Tompkins County | New York | 14 | 1.3% |
| 11 | Westmoreland County | Pennsylvania | 13 | 1.2% |
| 12 | Travis County | Texas | 13 | 1.2% |
| 13 | Rockland County | New York | 12 | 1.1% |
| 14 | Allegheny County | Pennsylvania | 12 | 1.1% |
| 15 | Erath County | Texas | 12 | 1.1% |
How recent are the peppered jumper records?
Most of what is known about the peppered jumper is recent: 89% of dated U.S. records were made in 2017–2026, and half date from 2023 or later. The oldest dated record is from 1927; the busiest year was 2025, with 225 records.
| Decade | Records | Share |
|---|---|---|
| 1920s | 6 | 0.5% |
| 1930s | 5 | 0.4% |
| 1940s | 3 | 0.3% |
| 1960s | 12 | 1.0% |
| 1970s | 5 | 0.4% |
| 1980s | 2 | 0.2% |
| 1990s | 3 | 0.3% |
| 2000s | 21 | 1.8% |
| 2010s | 210 | 18.3% |
| 2020s | 882 | 76.8% |
Species recorded in the same counties
Of the 176 counties where the peppered jumper is most recorded, 116 are also top counties for the bold jumper, more than for any other spider. None of its closest neighbors is venomous.
| Species | Shared counties |
|---|---|
| Bold jumper | 116 |
| Familiar jumping spider | 102 |
| Spotted orbweaver | 100 |
| Nursery web spider | 97 |
| Orchard orbweaver | 95 |
| Flea jumping spider | 94 |
| Black-and-yellow argiope | 93 |
| Bronze jumper | 90 |
Related species in the U.S.
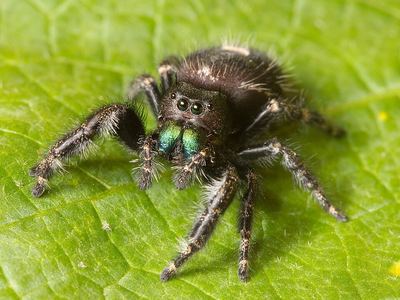
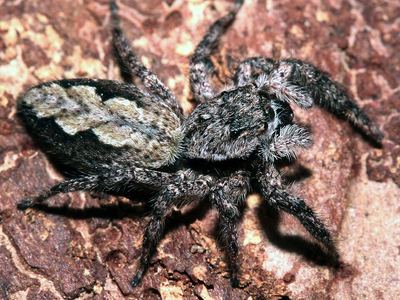
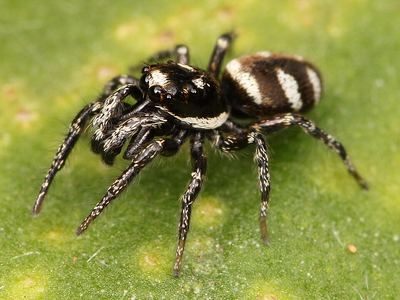
Other members of the family Salticidae with profiles here: Bold jumper, Familiar jumping spider, Zebra spider, Bronze jumper, Magnolia green jumper and Half-edged wall jumping spider.
GBIF records read 2026-09-29. Listed: any license. Counted: CC0/CC BY only. How we count.